Introduction
Expedia, Inc. (EXPE) reports Booked room nights in SEC filings; the metric has historically moved in tandem with stock performance over 4+ years. Among the hundreds Apptopia tracks, Mobile Performance Index (MPI), Downloads, MAU, DAU, Engagement, Time Spent & User Churn were selected for their persistent correlation with Booked room nights. This curated intelligence enables investors to monitor alternative data signals that historically anticipate Booked room nights trends.
Mobile Performance Index (MPI)
Growth Trends – Expedia, Inc.’s Mobile Performance Index showed Declining performance with -6.90% WoW and -27.70% YoY. The Declining trajectory indicates the index is moving lower, suggesting mobile engagement momentum is weakening. Sustained negative WoW and YoY readings indicate weakening momentum.
User Acquisition
New User Acquisition – Downloads reached 1.3M last week, up 11.49% WoW, down 87.39% QoQ, and down 17.74% YoY. The positive WoW growth alongside negative YoY indicates a recent momentum uptick after longer-term softness, while the pronounced QoQ drop reflects seasonal normalization.
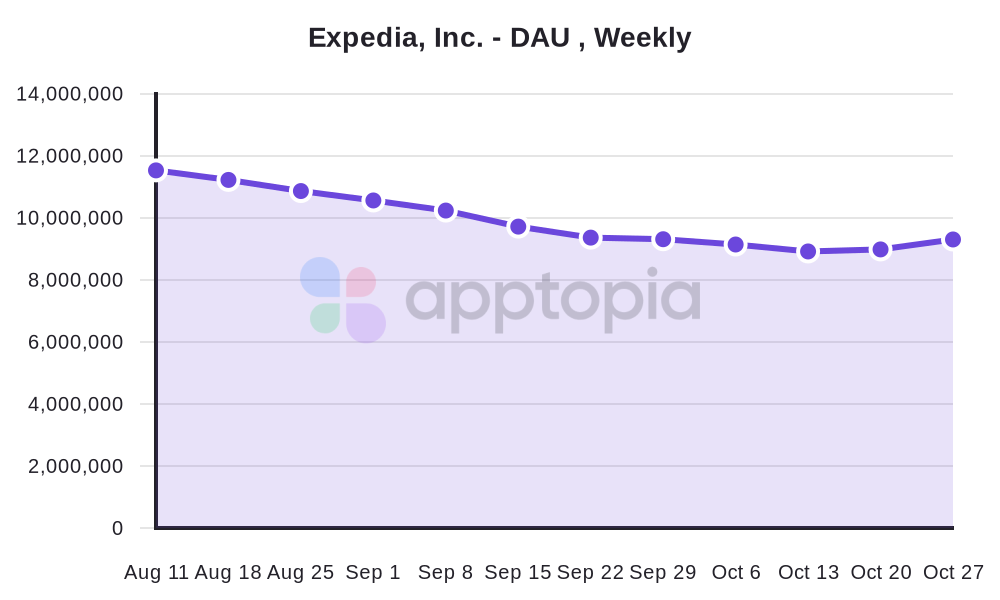
User Engagement
Existing User Engagement – Daily Active Users reached 9.16M (down 5.65% YoY), Total Time Spent declined 6.28% YoY to 79.3B hours, and Engagement Score fell 9.45% YoY to 0.0766. The synchronized declines across user counts and engagement depth indicate broader platform challenges. Notably, Total Time Spent also fell 85.48% QoQ. This represents a steep QoQ change. This pattern shows both fewer actives and lighter usage per user.
User Retention
User Retention – User churn reached 57.55% last week, up 3.99% WoW, up 2.17% QoQ, and down 3.23% YoY. This indicates mixed retention signals—near-term deterioration but improvement versus last year. The elevated churn above 55% represents significant user attrition and reflects weakened user retention health. YoY churn is lower while WoW and QoQ are higher; the churn rate remains elevated relative to healthy levels.
Conclusion
Conclusion – Expedia, Inc.’s mobile metrics show mixed dynamics with weakening engagement offset by a near-term acquisition uptick. MPI declined -6.90% WoW and -27.70% YoY, while downloads rose 11.49% WoW but fell 17.74% YoY; DAU reached 9.16M (-5.65% YoY) and Total Time Spent slid 6.28% YoY (and plunged 85.48% QoQ). The combination of softer engagement and a rising near-term churn rate (57.55%, +3.99% WoW, despite -3.23% YoY) suggests a leaky funnel where new installs are not converting into durable usage. Platform health appears pressured as engagement softens and churn remains elevated. Apptopia mobile intelligence data supports these readings across MPI, acquisition, engagement, and churn.
—
About Apptopia’s Mobile Intelligence Platform
There are hundreds of other metrics available throughout the Apptopia datasets, including 20+ segmentations to apply to those, such as Session Length, Sessions per User, Monthly Active Users (MAU), geographic breakdowns, and device types. Get in touch with Apptopia to learn more about the options available.