Introduction
Bumble (BMBL) reports Bumble App Paying Users in SEC filings, a KPI demonstrating correlation with stock performance over 4+ years. Among the hundreds Apptopia tracks, Mobile Performance Index (MPI), Downloads, MAU, DAU, Engagement, Time Spent & User Churn were selected for their persistent correlation with Bumble App Paying Users. This curated intelligence lets investors monitor alternative data signals correlated with Bumble App Paying Users.
Mobile Performance Index (MPI)
Growth Trends – Bumble’s Mobile Performance Index showed Declining performance with -1.03% WoW and -6.91% YoY decline. The Declining trajectory indicates performance is deteriorating, suggesting mobile engagement momentum is weakening from previous levels rather than stabilizing. This pattern reflects weaker app engagement relative to prior periods.
User Acquisition
New User Acquisition – Downloads reached 1.3M last week, down 2.05% WoW, down 84.87% QoQ, and down 34.06% YoY. The coordinated declines across all timeframes indicate sustained download challenges, with new user acquisition momentum under pressure in both short- and long-term periods.
User Engagement
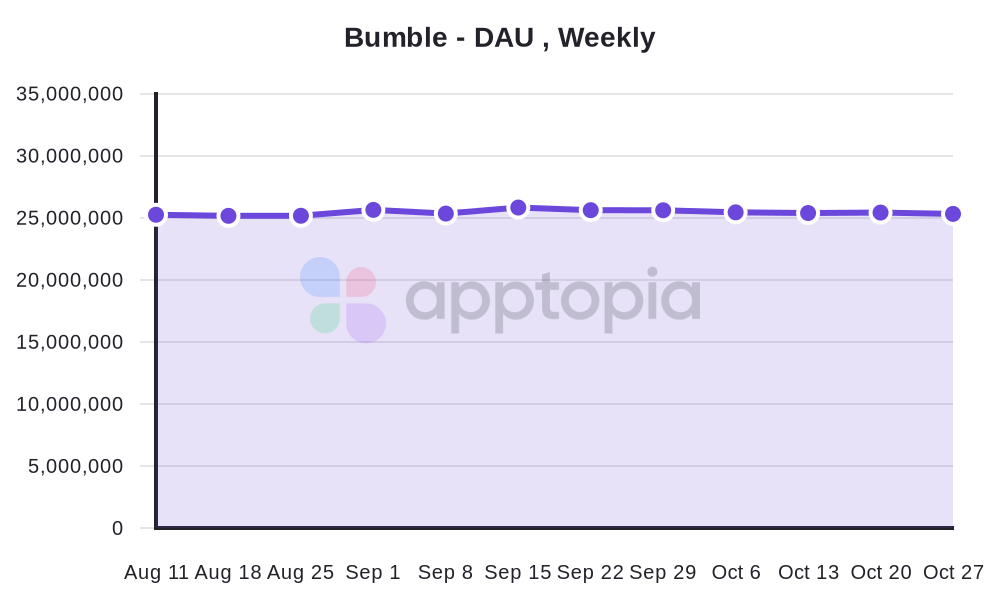
Existing User Engagement – Daily Active Users reached 25.4M users (down 3.15% YoY), Total Time Spent declined 5.81% YoY to 237.2B hours (and -83.67% QoQ), and Engagement Score fell 3.31% YoY to 0.2009. The synchronized declines across user counts and engagement depth point to broader platform challenges. The especially steep QoQ drop in time spent highlights pressure on sustained usage, implying engagement quality may be deteriorating faster than audience size.
User Retention
Retention and churn metrics were not available for this analysis. Accordingly, churn rate and directional changes (WoW, QoQ, YoY) cannot be reported here. This section focuses on available lifecycle data only; retention impact is not assessed.
Conclusion
Conclusion – Bumble’s mobile metrics show coordinated challenges across the user lifecycle. MPI declined -1.03% WoW and -6.91% YoY, downloads fell to 1.3M (-2.05% WoW, -84.87% QoQ, -34.06% YoY), while DAU reached 25.4M (-3.15% YoY) as total time spent slid -5.81% YoY (-83.67% QoQ) and the Engagement Score dropped -3.31% YoY to 0.2009. The combination of severe acquisition contraction and weakening engagement shows a shrinking funnel and shallower usage within the observed period; retention impact cannot be assessed here as churn data are not available. Downloads and session depth both declined in the observed period.
—
About Apptopia’s Mobile Intelligence Platform
There are hundreds of other metrics available throughout the Apptopia datasets, including 20+ segmentations to apply to those, such as Session Length, Sessions per User, Monthly Active Users (MAU), geographic breakdowns, and device types. Get in touch with Apptopia to learn more about the options available.