Introduction
Match Group Inc (MTCH) reports Tinder Payers in SEC filings, and it has shown historical co-movement with stock performance. Among the hundreds Apptopia tracks, Mobile Performance Index (MPI), Downloads, MAU, DAU, Engagement, Time Spent & User Churn were selected for their historical alignment with Tinder Payers. This curated intelligence enables investors to monitor alternative data signals related to Tinder Payers.
Mobile Performance Index (MPI)
Growth Trends – Match Group Inc’s Mobile Performance Index showed Declining performance with 6.67% WoW and -7.41% YoY. The Declining trajectory indicates the growth rate is slowing, suggesting mobile engagement momentum is moderating from previous levels. This combination shows positive WoW alongside negative YoY, indicating a recent momentum reversal.
User Acquisition
New User Acquisition – Downloads reached 3.8M last week, up 3.56% WoW, down 83.38% QoQ, and up 8.27% YoY. The positive weekly and annual growth alongside a steep quarterly drop suggests seasonal effects are suppressing near-term comps, while underlying acquisition momentum is improving versus last year.
User Engagement
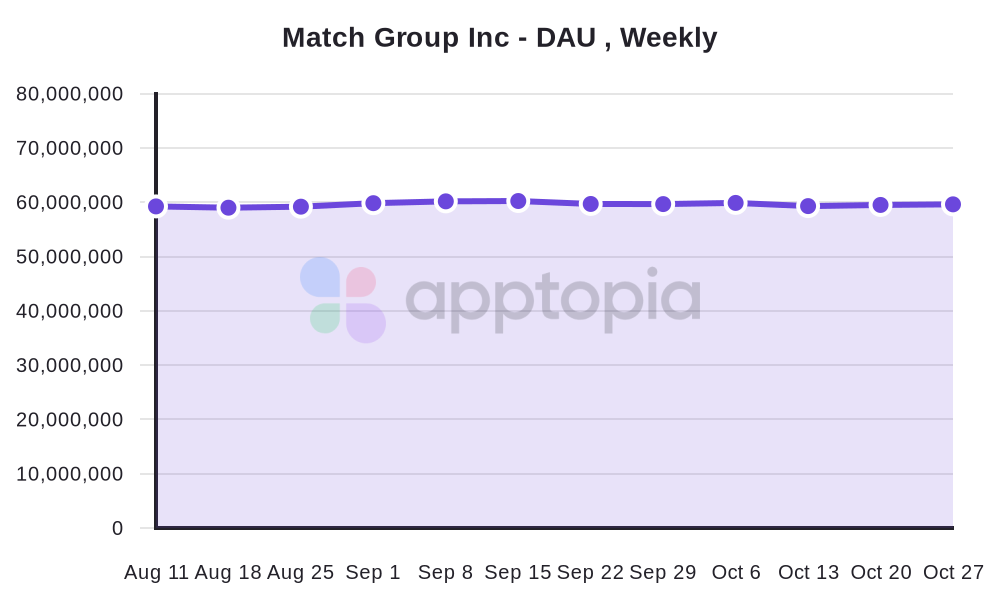
Existing User Engagement – Daily Active Users reached 59.6M (up 3.63% YoY), Total Time Spent grew 3.09% YoY to 814.6B hours, and Engagement Score rose 4.20% YoY to 0.2185. The combination of steady user growth and improving engagement intensity alongside moderate time expansion indicates healthy, incremental strengthening of platform usage. Notably, Total Time Spent declined -83.66% QoQ, a sharp sequential reset that contrasts with the positive YoY trend.
User Retention
Retention – Churn metrics were unavailable at the time of publication; a full retention assessment will be added when the data is available. Within this framework, higher churn indicates weaker retention; churn above 55% is considered elevated, and 58% represents significant attrition. Directional changes are interpreted as follows: negative WoW/QoQ/YoY churn movement indicates improvement, while positive movement indicates deterioration.
Conclusion
Conclusion – According to Apptopia’s Mobile Performance Index (MPI) and engagement data, Match Group Inc’s mobile metrics show mixed dynamics across the user lifecycle. MPI improved 6.67% WoW but remains -7.41% YoY, and downloads reached 3.8M (+3.56% WoW, +8.27% YoY) despite an -83.38% QoQ drop. Engagement is steadily strengthening with DAU at 59.6M (+3.63% YoY), total time +3.09% YoY, and engagement score +4.20% YoY, offset by an -83.66% QoQ reset. Positive WoW alongside negative YoY indicates mixed momentum, and sharp QoQ pullbacks contrast with YoY gains; with churn data unavailable, retention assessment remains pending.
—
About Apptopia’s Mobile Intelligence Platform
There are hundreds of other metrics available throughout the Apptopia datasets, including 20+ segmentations to apply to those, such as Session Length, Sessions per User, Monthly Active Users (MAU), geographic breakdowns, and device types. Get in touch with Apptopia to learn more about the options available.