Introduction
Airbnb (ABNB) reports Nights and Experiences Booked in SEC filings, and the KPI is commonly evaluated alongside stock performance. Among the hundreds Apptopia tracks, Mobile Performance Index (MPI), Downloads, MAU, DAU, Engagement, Total Time Spent and User Churn were selected as metrics commonly analyzed alongside Nights and Experiences Booked. This curated intelligence provides investors alternative data signals correlated with reported Nights and Experiences Booked trends.
Mobile Performance Index (MPI)
Growth Trends – Airbnb (ABNB)’s Mobile Performance Index showed Declining performance with -27.78% WoW and -8.05% YoY decline. The Declining trajectory indicates performance is contracting rather than stabilizing or accelerating, suggesting mobile engagement momentum is weakening. Across recent comparisons, MPI declined -27.78% WoW and -8.05% YoY.
User Acquisition
New User Acquisition – Downloads reached 1.8M last week, up 7.10% WoW, down 84.91% QoQ, and down 9.90% YoY. The positive WoW alongside negative YoY indicates recent acquisition momentum improvement after longer-term softness.
User Engagement
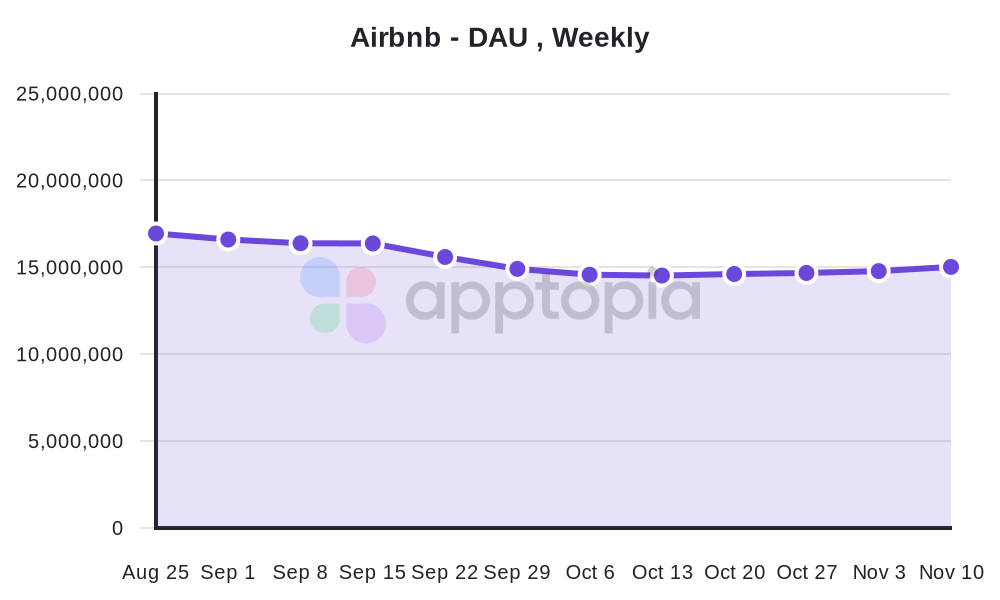
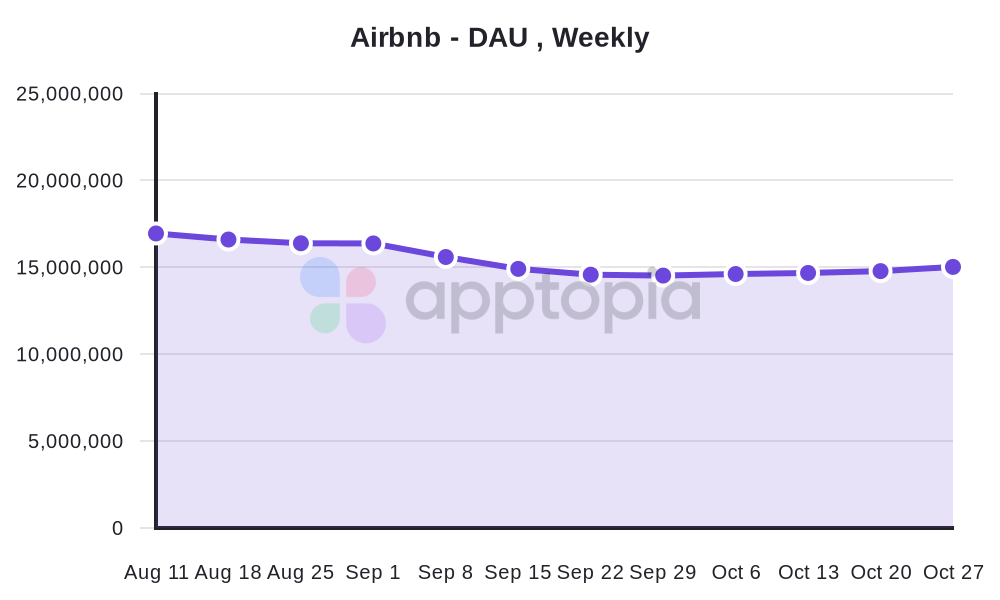
Existing User Engagement – Daily Active Users reached 14.9M (up 9.65% YoY), Total Time Spent grew 8.04% YoY to 183.5B hours, and Engagement Score declined -3.4% YoY to 0.1125. The combination of rising user counts and overall usage with weakening engagement intensity per user indicates quantity-focused growth over depth of engagement. Still, Total Time Spent declined 84.65% QoQ, tempering the otherwise positive annual trend.
User Retention
User Retention – User churn at Airbnb reached 58.01% last week, up 1.69% WoW, up 3.26% QoQ, and up 3.99% YoY. This indicates deteriorating retention trends across all timeframes, with over half of users churning, a significant level of customer attrition. The elevated churn above 55% signals customer health challenges and threatens long-term platform health, suggesting acquisition gains may be offset by losses.
Conclusion
Conclusion – Based on Apptopia’s mobile intelligence, Airbnb’s mobile metrics show mixed dynamics across the user lifecycle. MPI declined -27.78% WoW and -8.05% YoY, downloads rose +7.10% WoW but fell -9.90% YoY and -84.91% QoQ, while DAU grew +9.65% YoY and Total Time Spent increased +8.04% YoY despite an -84.65% QoQ plunge and an Engagement Score down -3.4% YoY. The combination of near-term acquisition upticks with weakening per-user intensity and elevated churn at 58.01% (rising WoW/QoQ/YoY) suggests a leaky funnel where user expansion is not translating into durable retention.
—
About Apptopia’s Mobile Intelligence Platform
There are hundreds of other metrics available throughout the Apptopia datasets, including 20+ segmentations to apply to those, such as Session Length, Sessions per User, Monthly Active Users (MAU), geographic breakdowns, and device types. Get in touch with Apptopia to learn more about the options available.